

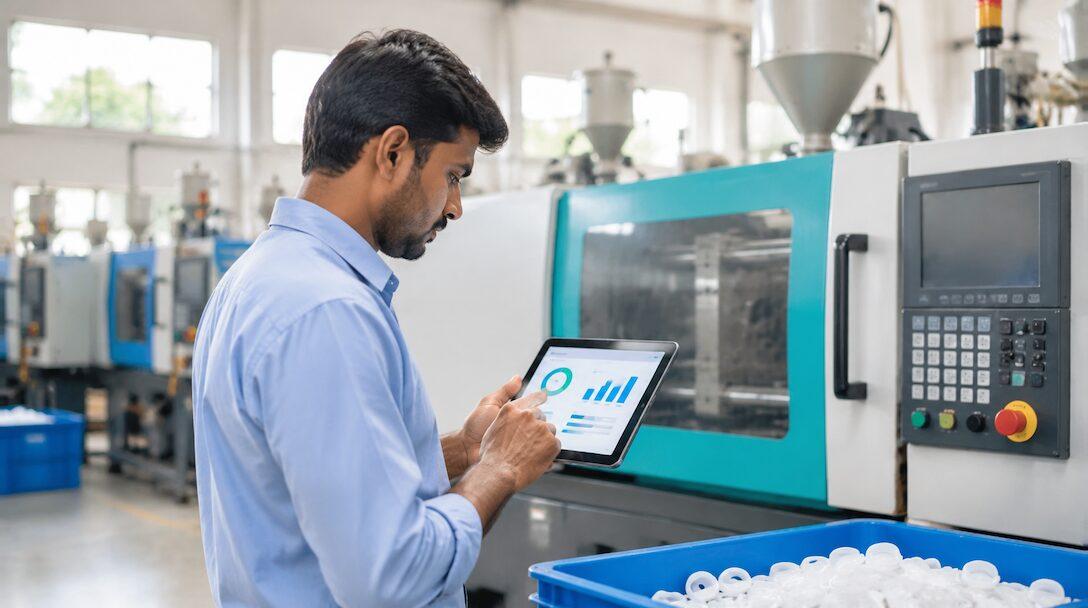
Picture a 60-person injection moulding plant near Manesar with 14 presses running two shifts. The owner wants to know why the plant shipped less this month than the presses should be able to make. The production manager says the moulds are fine; the maintenance head blames power cuts; the quality supervisor points at short shots on two moulds. Nobody can prove their case, because the numbers live in a shift register, a WhatsApp group and an Excel file. MES and OEE software exist to close that gap. Below: what an MES does versus an ERP, when a small Indian plant needs one at all, and how to calculate OEE on a worked press example.
TL;DR
- An ERP plans and records the business: orders, BOMs, stock, purchase, cost and GST. An MES runs the floor in real time: what each machine is doing now, counts, stops and rejects. In ISA-95 terms they are levels 4 and 3.
- OEE = Availability x Performance x Quality. In our worked example, a 4-cavity mould on one press for one shift comes out at 74.7 percent.
- ERPNext v16 records most OEE inputs natively: workstation hours, Downtime Entries with stop reasons, Job Card time logs with completed and process loss quantities, and BOM operation times.
- What ERPNext lacks is automatic capture from the machine and a ready OEE report. Both are scoped custom work, not a reason to buy a second system on day one.
- A full MES makes sense when you need second-level machine data across many machines or strict batch genealogy.
Free ERPNext fit check
Will ERPNext fit your factory?
Answer a few quick questions. On a short call we tell you whether ERPNext fits how you make, stock and sell, and what the rollout looks like.
Check my fit →MES vs ERP: two layers, two clocks
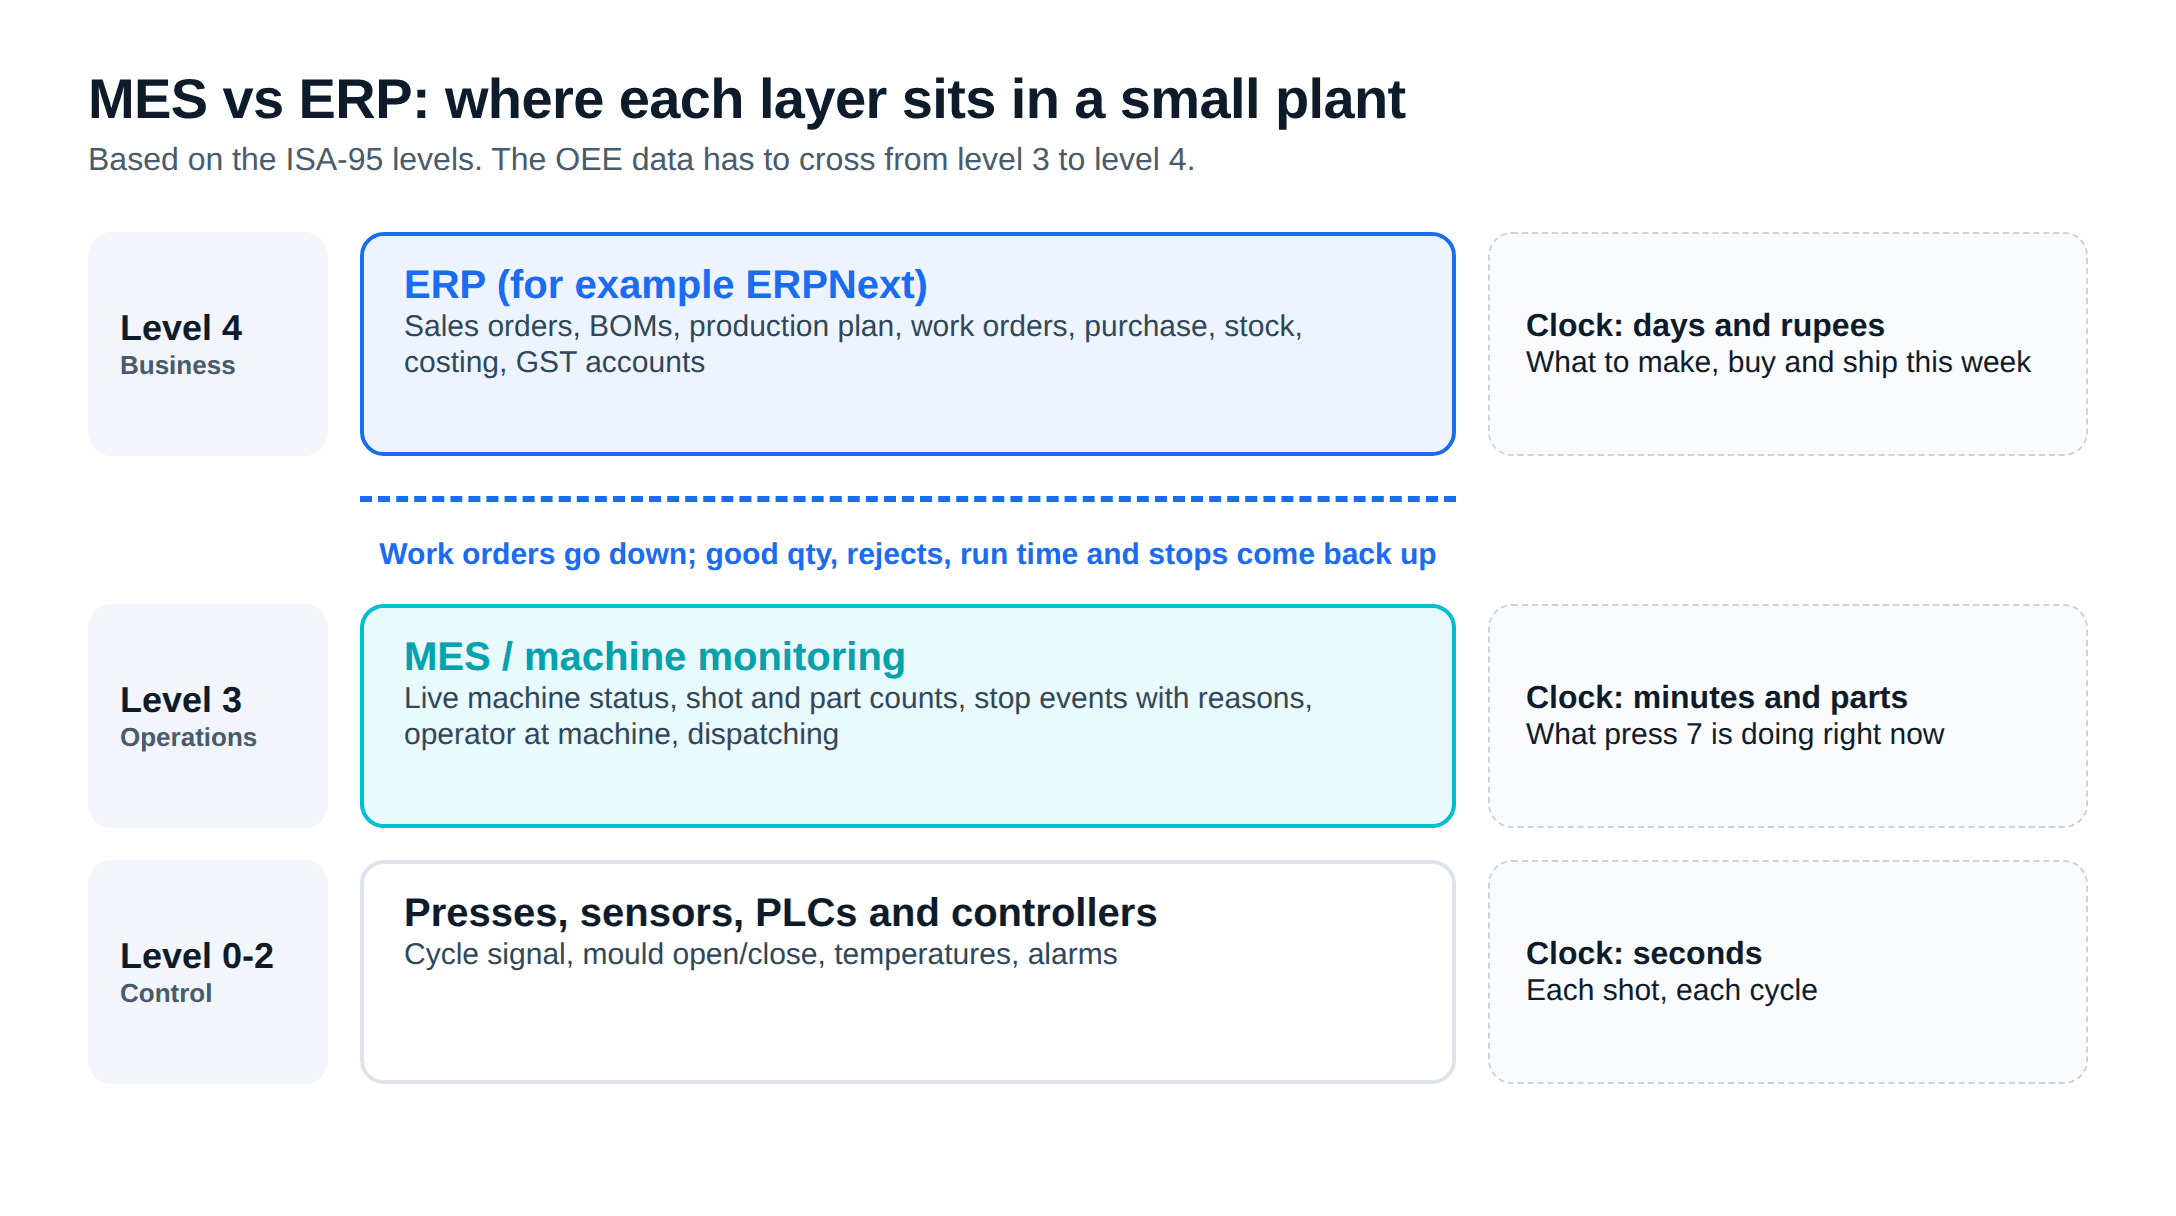
The clearest way to separate the two is the ISA-95 standard, which splits a manufacturing company into levels. Levels 0 to 2 are the machines, sensors and controllers such as PLCs. Level 3 is manufacturing operations systems, which ISA names as MES and SCADA. Level 4 is business functions, including ERP. In ISA's words, the standard "primarily deals with the interface between levels 3 and 4."
In plain terms:
- The ERP works in days and money. It takes a sales order, explodes the BOM, plans purchase and production, issues the work order, receives finished goods into stock, and posts the cost to the books. Our MRP vs ERP guide covers that planning chain.
- The MES works in minutes and parts. It knows which mould is on press 7 right now, how many shots it has made since 6 am, that it stopped for 12 minutes at 9:40 and why, and how many parts went to the reject bin.
ERP owns
MES owns
Both touch
The third card is where the two blur. A Job Card in an ERP and a job screen in an MES record the same facts: start, stop, good quantity, rejects. The difference is who enters them and how often. In an ERP a supervisor usually types them at the end of a run or shift. In an MES the machine reports them as they happen.
When a small plant needs an MES at all
For a 20-200 person plant the answer may well be "not yet". An MES only helps once there is a reliable plan for it to execute and a stock and cost system to report into. If work orders still live in a register and material is short half the time, an MES will measure the chaos precisely without fixing it. Our post on production planning software for small plants works through that question first.
Consider a separate MES, or at least machine monitoring software, when most of these hold:
- You already run work orders and job cards in an ERP, and the data is entered every shift.
- Hand-entered counts and stop times disagree with what the machines produced (for example, the shift report says 4,500 parts and the store receives 4,100).
- Short stops of a minute or two are frequent, and nobody writes them down.
- Customers ask for traceability down to the machine, mould and shift for each lot.
- One supervisor can no longer watch every machine in a shift.
If only the first two hold, the cheaper path is to capture counts and stops from the machines straight into the ERP, which we cover below.
How to calculate OEE
Overall equipment effectiveness compares what a machine made with what it could have made in the time it was scheduled to run. OEE software automates the arithmetic, but it is simple enough to check by hand. The definitions below follow OEE.com's calculation guide:
- Availability = Run Time / Planned Production Time. Planned production time is shift time minus time with no intention to run, such as breaks. Run time is planned production time minus stop time.
- Performance = (Ideal Cycle Time x Total Count) / Run Time. Ideal cycle time is the fastest cycle the process can achieve in optimal conditions.
- Quality = Good Count / Total Count.
- OEE = Availability x Performance x Quality.
Each factor points to a different owner. Availability losses are stops: breakdowns, mould changes, power cuts, waiting for material. Performance losses are slow cycles and short stops nobody logged. Quality losses are rejects and startup scrap.
Worked example: one press, one shift
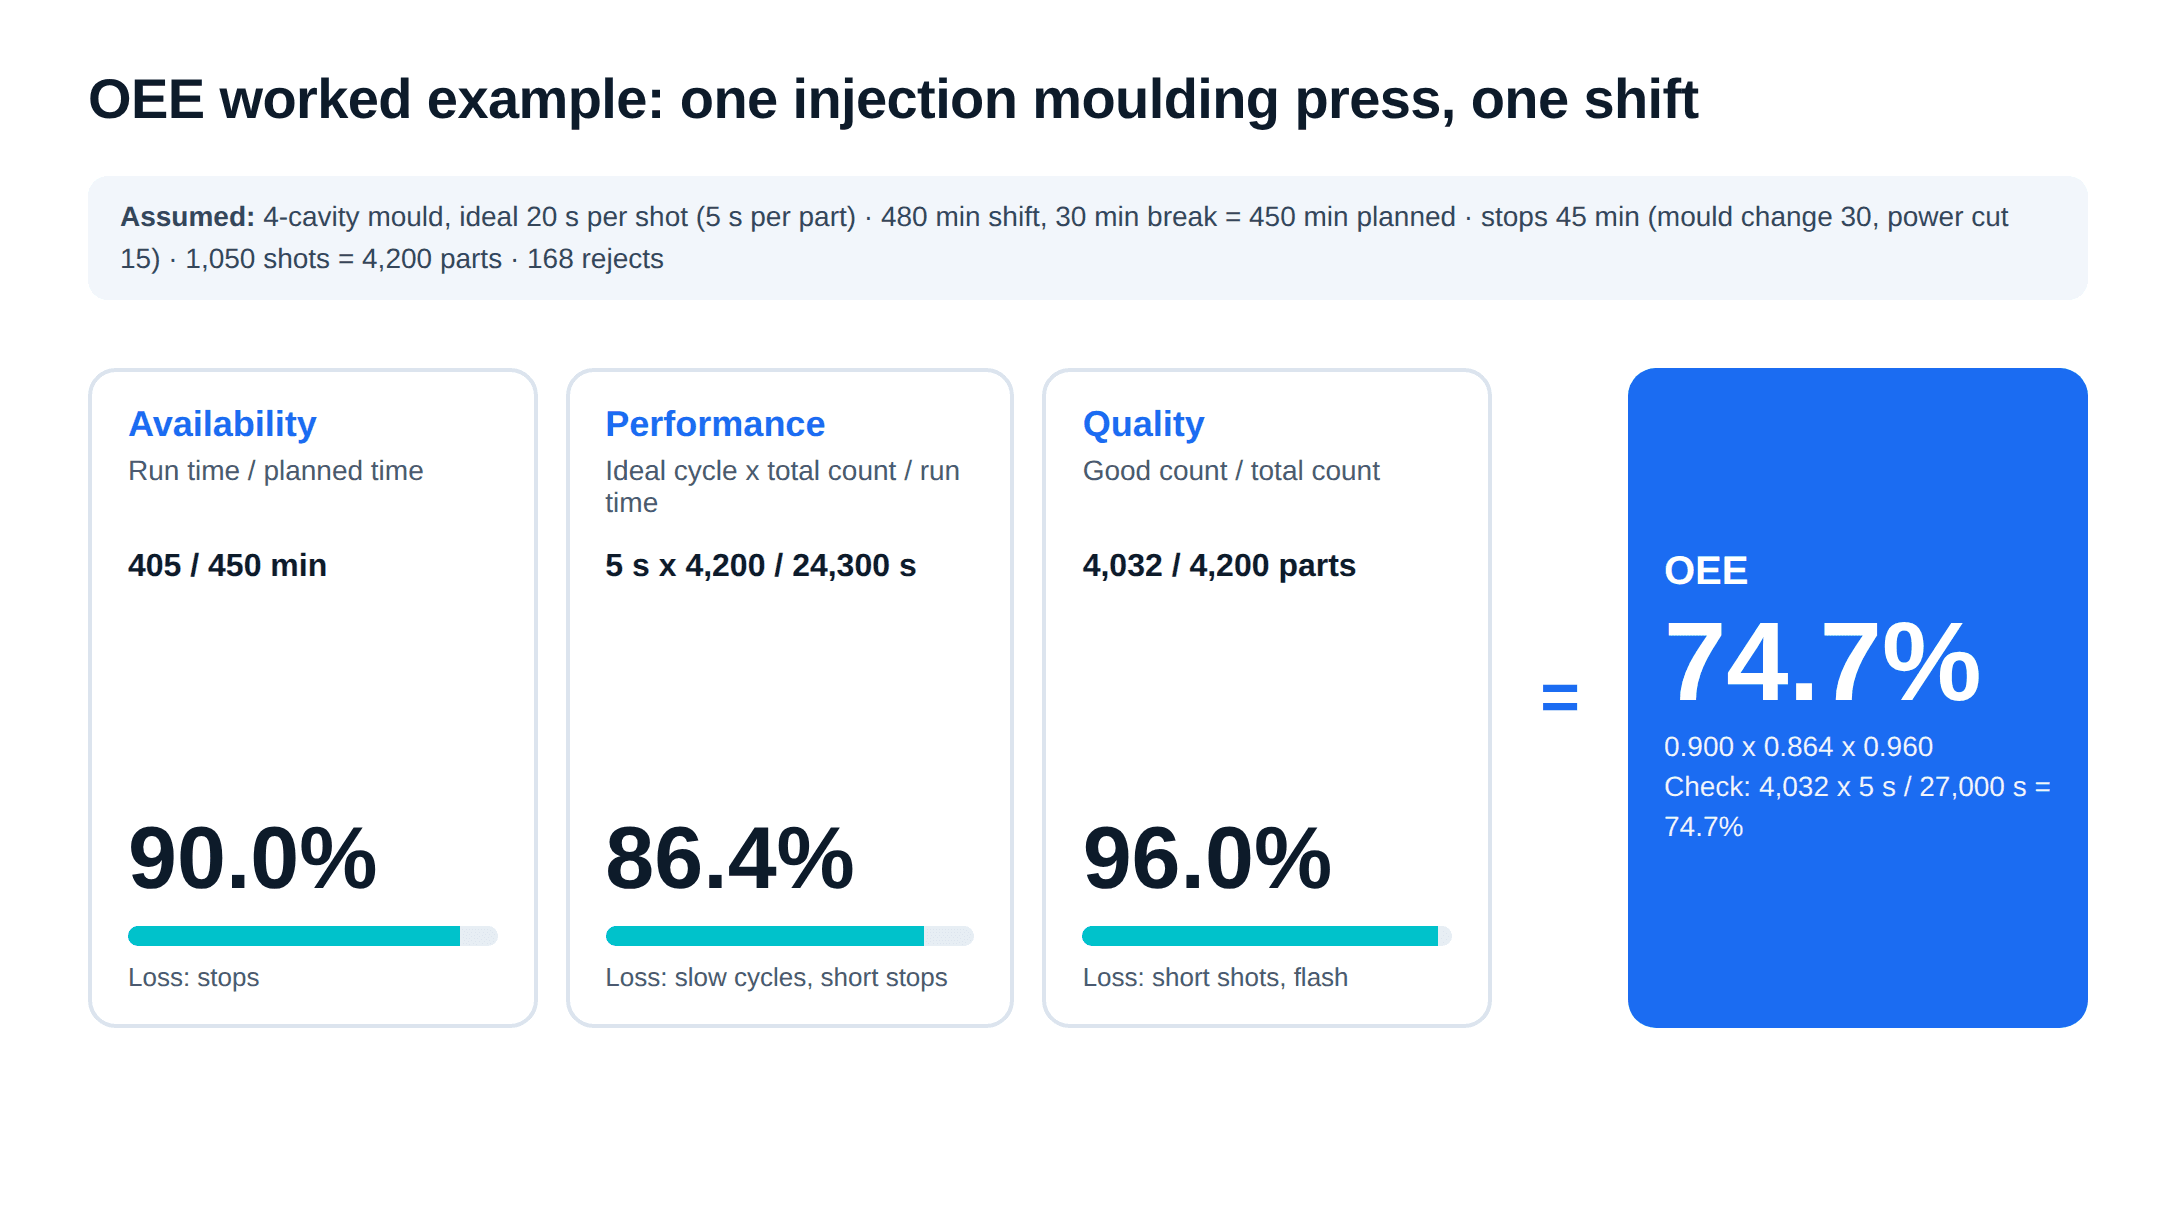
Example, with every number assumed for illustration:
- Product: a polypropylene closure on a 4-cavity mould.
- Ideal cycle time: 20 seconds per shot, so 5 seconds per part (20 / 4 cavities).
- Shift: 8 hours (480 minutes), with a 30-minute meal break. Planned production time is 450 minutes.
- Stops: a 30-minute mould change and a 15-minute power cut. Stop time is 45 minutes, so run time is 405 minutes (24,300 seconds).
- Output: 1,050 shots, which is 4,200 parts.
- Rejects: 168 parts (short shots and flash). Good count is 4,032.
Now the three factors:
- Availability = 405 / 450 = 90.0 percent.
- Performance = (5 s x 4,200) / 24,300 s = 21,000 / 24,300 = 86.4 percent. At the ideal 20 seconds a shot, 405 minutes allows 1,215 shots; the press made 1,050, so cycles ran slow or it paused without anyone logging a stop.
- Quality = 4,032 / 4,200 = 96.0 percent.
- OEE = 0.900 x 0.864 x 0.960 = 74.7 percent.
Cross-check: good parts x ideal time per part / planned time = (4,032 x 5) / (450 x 60) = 20,160 / 27,000 = 74.7 percent. The two methods agree.
Injection moulding details that change the answer
- Count against designed cavities. If one cavity of four is blocked and the press keeps running, each shot makes three parts. If ideal cycle time per part still uses four cavities, the lost cavity shows up as a performance loss, which is where you want to see it. If you quietly change the divisor to three, the loss disappears from the number.
- Decide where the mould change goes. We counted it as stop time, an availability loss. Some plants exclude planned changeovers from planned production time. Either works, but pick one rule and apply it to every press, or comparisons between machines mean nothing.
- Count startup scrap. Parts rejected while the mould comes up to temperature are quality losses. If they go in the regrind bin unrecorded, quality looks better than it is.
- Use the ideal cycle, not the standard. If the cycle time in the system is padded for costing, performance will look close to 100 percent and hide slow running.
What ERPNext records natively
We checked the v16 documentation and the v16 document definitions. ERPNext already has a place for most OEE inputs, so a separate system is not needed to start measuring.
- Planned time. A Workstation holds working hours (split by shift if needed) and a holiday list. That gives planned production time per press.
- Stops. A Downtime Entry records the workstation, operator, from and to time and the minutes lost. In v16 its stop reason list includes excessive machine set up time, unplanned machine maintenance, on-machine press checks, machine operator errors, machine malfunction, electricity down, and other. The Downtime Analysis report shows downtime by machine in hours.
- Run time and counts. A Job Card is created per operation of a Work Order. Its time logs hold start and end times, the employee, the completed quantity and a process loss quantity for each session. It can also link an in-process Quality Inspection.
- Ideal cycle time. Each operation on a BOM has an operation time in minutes and a batch size. Set it to the ideal cycle and it becomes the OEE baseline.
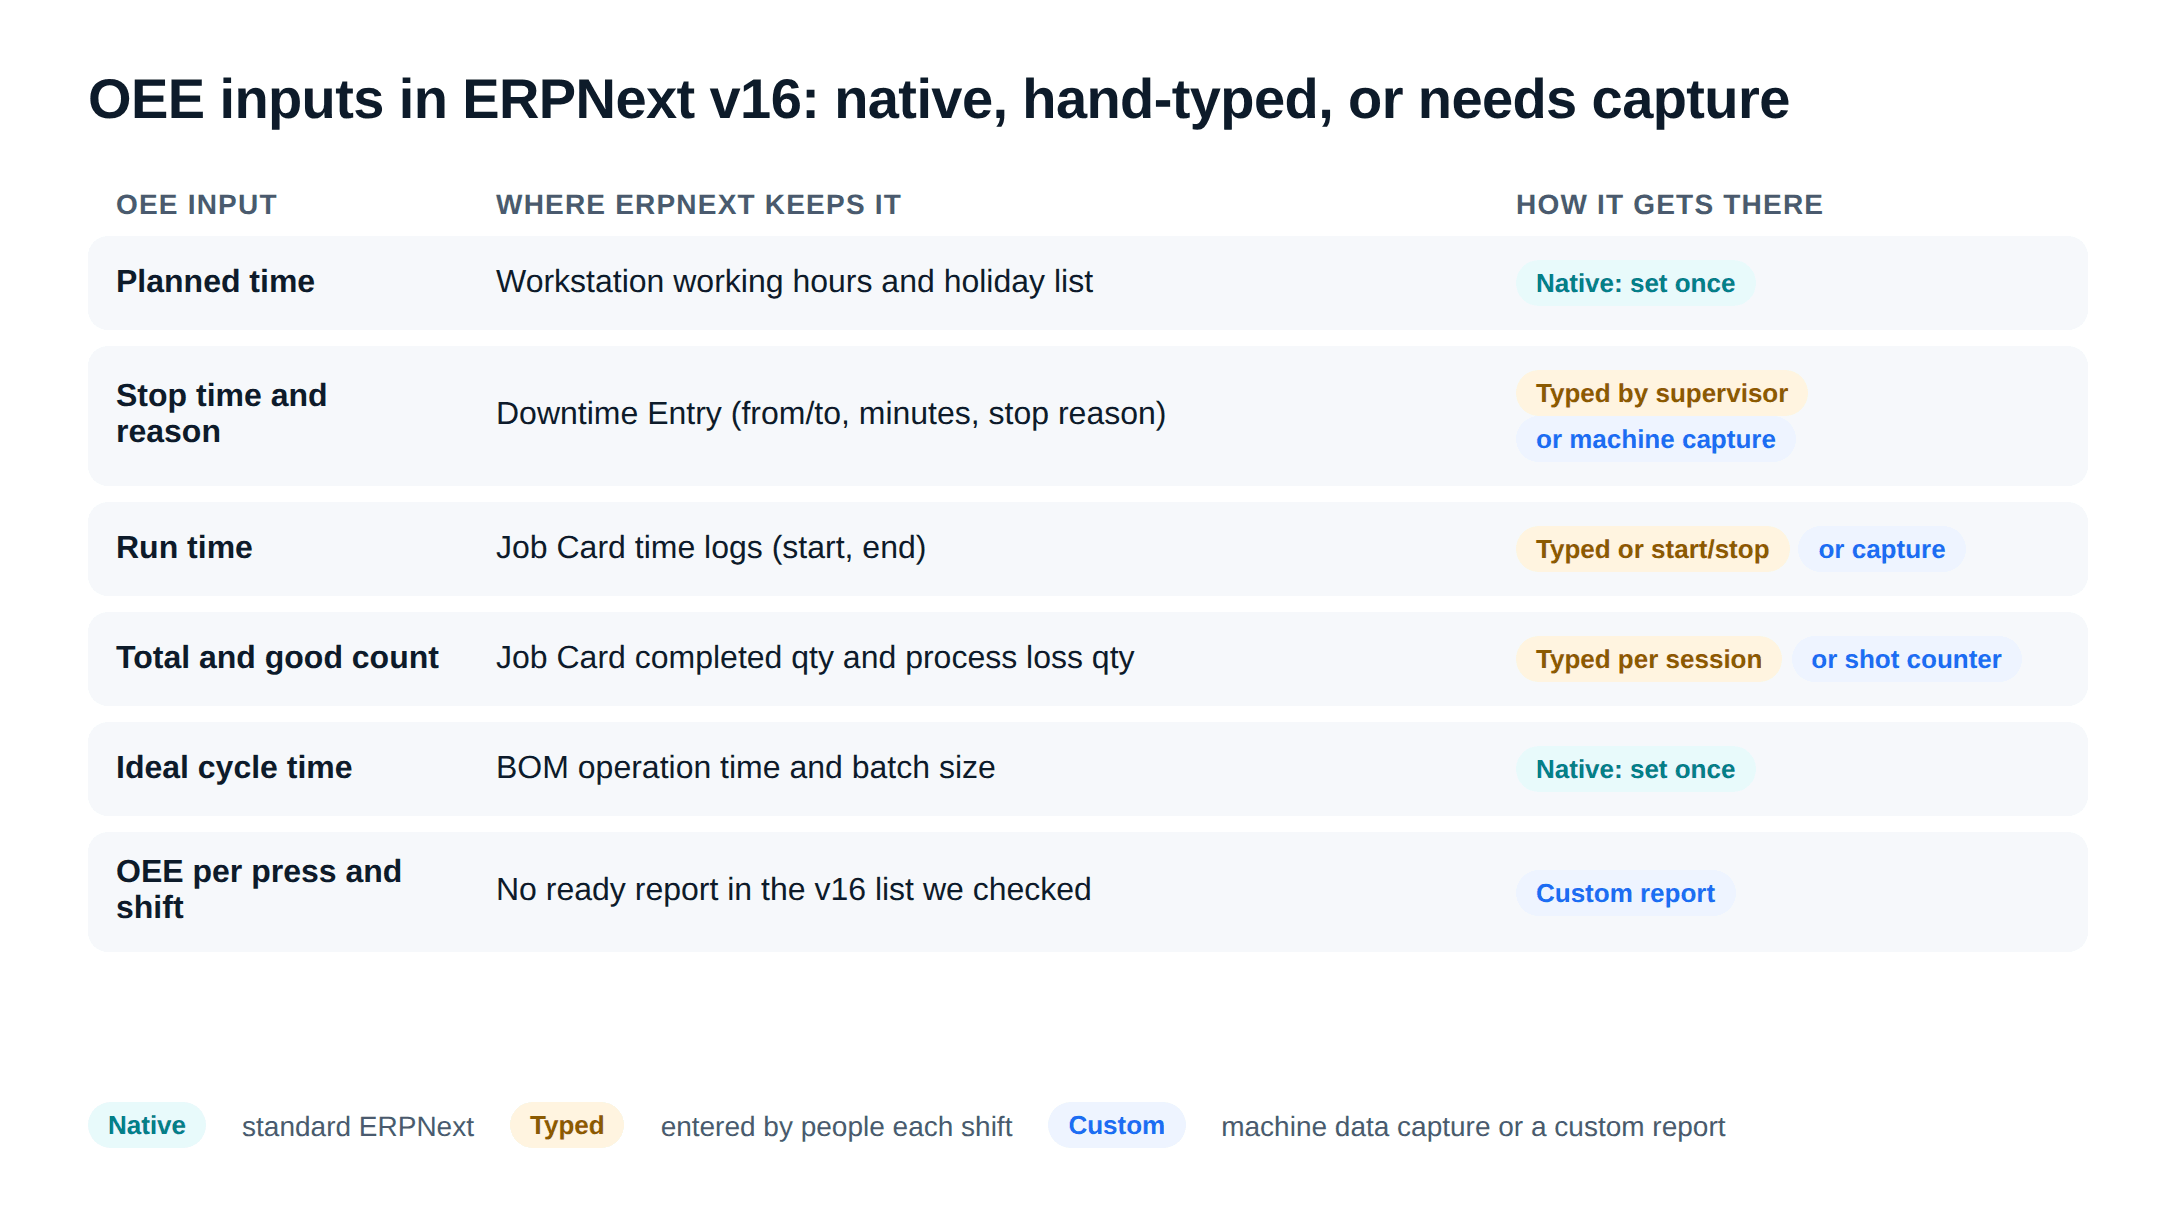
So availability, performance and quality can all be worked out from ERPNext records, as long as supervisors enter downtime and job card quantities every shift. Our ERPNext production planning, BOM and MRP walkthrough shows how the Work Order and Job Card chain is set up.
What needs machine data capture or a custom app
Gaps to plan for
- No ready OEE report. The v16 manufacturing reports include Downtime Analysis, Job Card Summary, Process Loss Report and Production Analytics, but none named OEE in the list we checked. A custom report that joins workstation hours, downtime entries and job card logs per press and shift fills it.
- No automatic capture. Counts and stops are typed by people. Short stops and slow cycles, the performance losses, are the easiest to leave out of a register, so performance computed from typed data is likely to look better than it is.
Closing the second gap does not require a full MES. Where a press controller exposes a cycle or shot signal, or a contact can be wired to a counter, a small gateway on the shop floor can read that signal, decide when the press is running or stopped, and post shot counts and stop events into ERPNext through the Frappe REST API, which accepts new documents as JSON with token authentication. The supervisor then only adds the stop reason and the reject count instead of typing everything.
That is ERPNext development work: the gateway, the mapping to Job Cards and Downtime Entries, and an OEE report with a per-shift view. Scope it press by press, starting with the two or three bottleneck machines, and check what each press controller exposes before promising live data from it. For other systems that connect to ERPNext, see ERPNext integrations in India.
A sensible order for a moulding plant
- Get the ERP basics right. Items, BOMs with operations, workstations with real shift hours, and work orders. The ERP guide for plastics manufacturers covers regrind, moulds and colour changes.
- Record job cards and downtime by hand for a month. It builds the habit and gives a first OEE number, even if performance looks flattering.
- Build the OEE report on those records, so the owner, production and maintenance argue from one number per press.
- Add machine capture on the bottleneck presses once the hand-entered data shows where the losses are.
- Price a full MES only if you then need second-level data on many machines, electronic batch records or deeper genealogy than the ERP can hold.
Metageeks is an independent ERPNext implementation company. If you want the first three steps done on your own presses, ERPNext implementation for manufacturers explains how we scope a plant, and what the system will record versus what supervisors will still enter.
Frequently asked questions
What is the difference between MES and ERP?+
An ERP runs the business side of the plant: orders, BOMs, purchase, stock, costing and accounts, usually planned in days. An MES runs the shop floor in minutes and seconds: which job is on which machine now, how many good parts came off, why the machine stopped. In the ISA-95 model the ERP sits at level 4 and the MES at level 3, and the standard mainly deals with the interface between the two.
How do you calculate OEE?+
OEE is Availability x Performance x Quality. Availability is run time divided by planned production time. Performance is ideal cycle time multiplied by total count, divided by run time. Quality is good count divided by total count. The same answer comes from good count x ideal cycle time / planned production time, which is a useful cross-check.
Does ERPNext calculate OEE?+
Not as a built-in report in the v16 report list we checked. ERPNext does record the inputs: workstation working hours, Downtime Entries with a stop reason, Job Card time logs with completed and process loss quantities, and the operation time on the BOM. An OEE report built from those records is a small custom report, not a separate system.
Does a small plant need MES software?+
Not necessarily as a separate product at first. If job cards, downtime entries and rejects are already recorded in the ERP and the main gap is accurate counts and stop times, automatic machine data capture into the ERP closes most of it. A full MES earns its cost when you need second-by-second machine data across many machines, electronic batch records, or strict genealogy that the ERP cannot hold.
What is machine monitoring software?+
Machine monitoring software reads signals from the machine, such as a cycle or shot counter, a running or stopped signal, and sometimes PLC data, and turns them into live status, counts and stop durations. A plant can start with monitoring on a few bottleneck machines before considering a full MES, and post the data into its ERP so counts and downtime are not typed by hand.
Related reading
- ERP for plastics manufacturers: moulds, regrind, colour changes and what to test.
- Production planning software for small plants: BOMs, planning and scheduling, and where ERPNext stops.
- MRP vs ERP: when a planning tool is enough and when the plant needs the whole system.
- ERPNext production planning, BOM and MRP: the step-by-step setup.
Free ERPNext fit check
Will ERPNext fit your factory?
Answer a few quick questions. On a short call we tell you whether ERPNext fits how you make, stock and sell, and what the rollout looks like.
Check my fit →About the author

- Tags
- erpnext
- erp
- manufacturing
- india
- production planning
Subscribe to Our Newsletter
The AI Build Brief: practical playbooks on how to build, price and ship AI features, in one short email every other week.